HMC performance with InfluxDB and Grafana
I modified my nmon2influxdb tool to import HMC Performance and Capacity Monitoring(PCM) data in InfluxDB.
HMC PCM data
Honestly I knew it was available since a long time but I didn’t see a use case at first. But talking with users from nmon2influxdb I saw most of the them was not using the tool to analyze nmon files but to have a consolidated view of all their servers. Loading data from the HMC itself it’s easy to setup and PCM data are pretty interesting. And you have a lot less measurements compared to nmon making it easier to centralize performance metrics from hundreds of partitions and servers.
Here a gist showing an entry example for a partition.
I choose to use the Processed Metrics with the default sample of every 30 seconds and fetching the last two hours of statistics.
So import should be done every 120 minutes or a little bit less to be safe.
HMC import
I updated the nmon2influxdb.org site with the latest informations. This post is mostly to show use cases.
You should have a look to demo.nmon2influxdb.org to HMC partition and HMC system dashboards to have a look what the results can be. User and password are demo.
After downloading the latest binary from github, you should update the configuration file ~/.nmon2influxdb.cfg with the informations needed to connect to your HMC:
hmc_server = "myhmc"
hmc_user = "hscroot"
hmc_password = "abc123"
After that, you just need to run the command:
nmon2influxdb hmc import
Getting list of managed systems
MANAGED SYSTEM: p750A
partition powerVC: 2940 points
MANAGED SYSTEM: p720-NIM_RETIRED
Error getting PCM data
MANAGED SYSTEM: POWER8-S824A
partition WM-SLES1: 17885 points
partition LV-PCM-Manager: 8330 points
partition PowerVC-LE: 7105 points
partition LVL-cluster2: 7134 points
partition lvl-cluster1: 7134 points
partition WM-SLES2: 17958 points
MANAGED SYSTEM: p750B
partition adxlpar2: 2952 points
partition adxlpar1: 4182 points
You can also specify options manually:
nmon2influxdb hmc import --hmc myhmc --hmcuser hscroot --hmcpass abc123Note: I don’t like to have clear passwords in my configuration file. I plan to fix it in issue #29 but I would like to have a better configuration management module. I know what I want, I just need time to code it. :)
You can use pre-built dashboards available with the new release. I am still experimenting with the display of HMC metrics and didn’t want to hardcode dashboard for now. To load them in your grafana instance:
 nmon2influxdb dashboard hmc_partition.json
 nmon2infuxdb dashboard hmc_server.json
partition measurements
PartitionProcessor
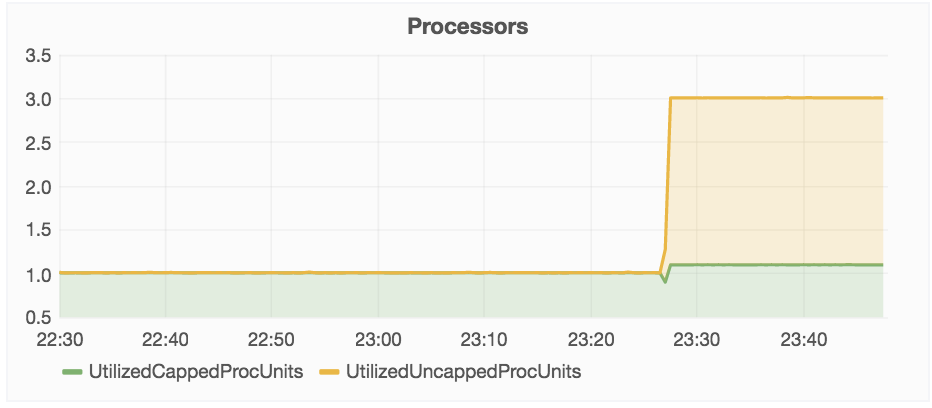
What is really interesting here are the processing units measurements: you can see capped, uncapped or donated processing units. Obviously, you can also see the maximum and entitled processing units.
Here an example displaying the capped and uncapped processing units used by a partition:
PartitionMemory
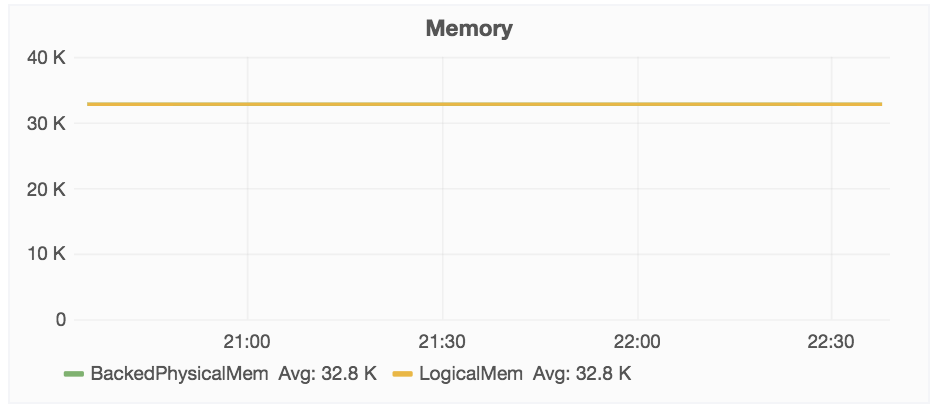
Memory is less interesting. You can see the amount of physical and logical memory allocated which will change if you are using Active Memory Sharing or Active Memory Expansion but you will have no statistics about this memory’s usage. You need operating system’s statistics here.
PartitionVSCSIAdapters
If you look quickly, you will not see the difference with a nmon report. But here the data doesn’t show the vscsi device on partition’s side but the vhost device on the vio servers.

Note: it’s only displaying vio server by ID and not the vio’s partition name. I am thinking about fetching it from the system but it’s low priority for now. Let me know if you are interested. :)
PartitionVirtualEthernetAdapters
This one is one of the most interesting. Again you can see what is the vio server used to bridge the network traffic:

You can also see the differences between virtual traffic(between partitions in the same system) and physical(what is sent outside the system through vios).

I am just showing here some of the data aggregation capabilities. You can also filter a entire system by vswitch id for example.
PartitionVirtualFiberChannelAdapters
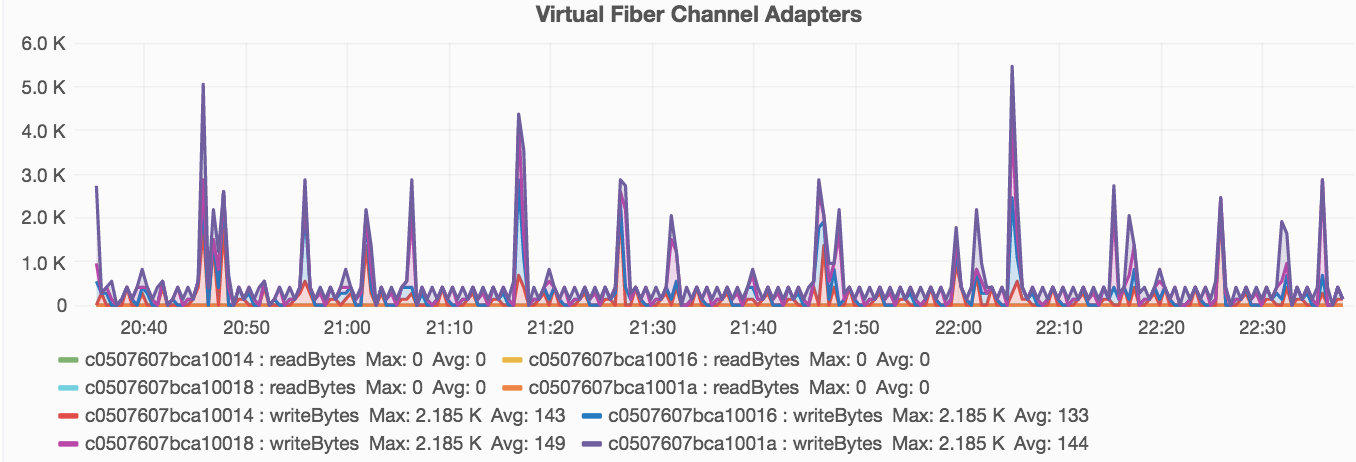
It’s something really similar to vscsi. By default, you can see the same kind of output than nmon:
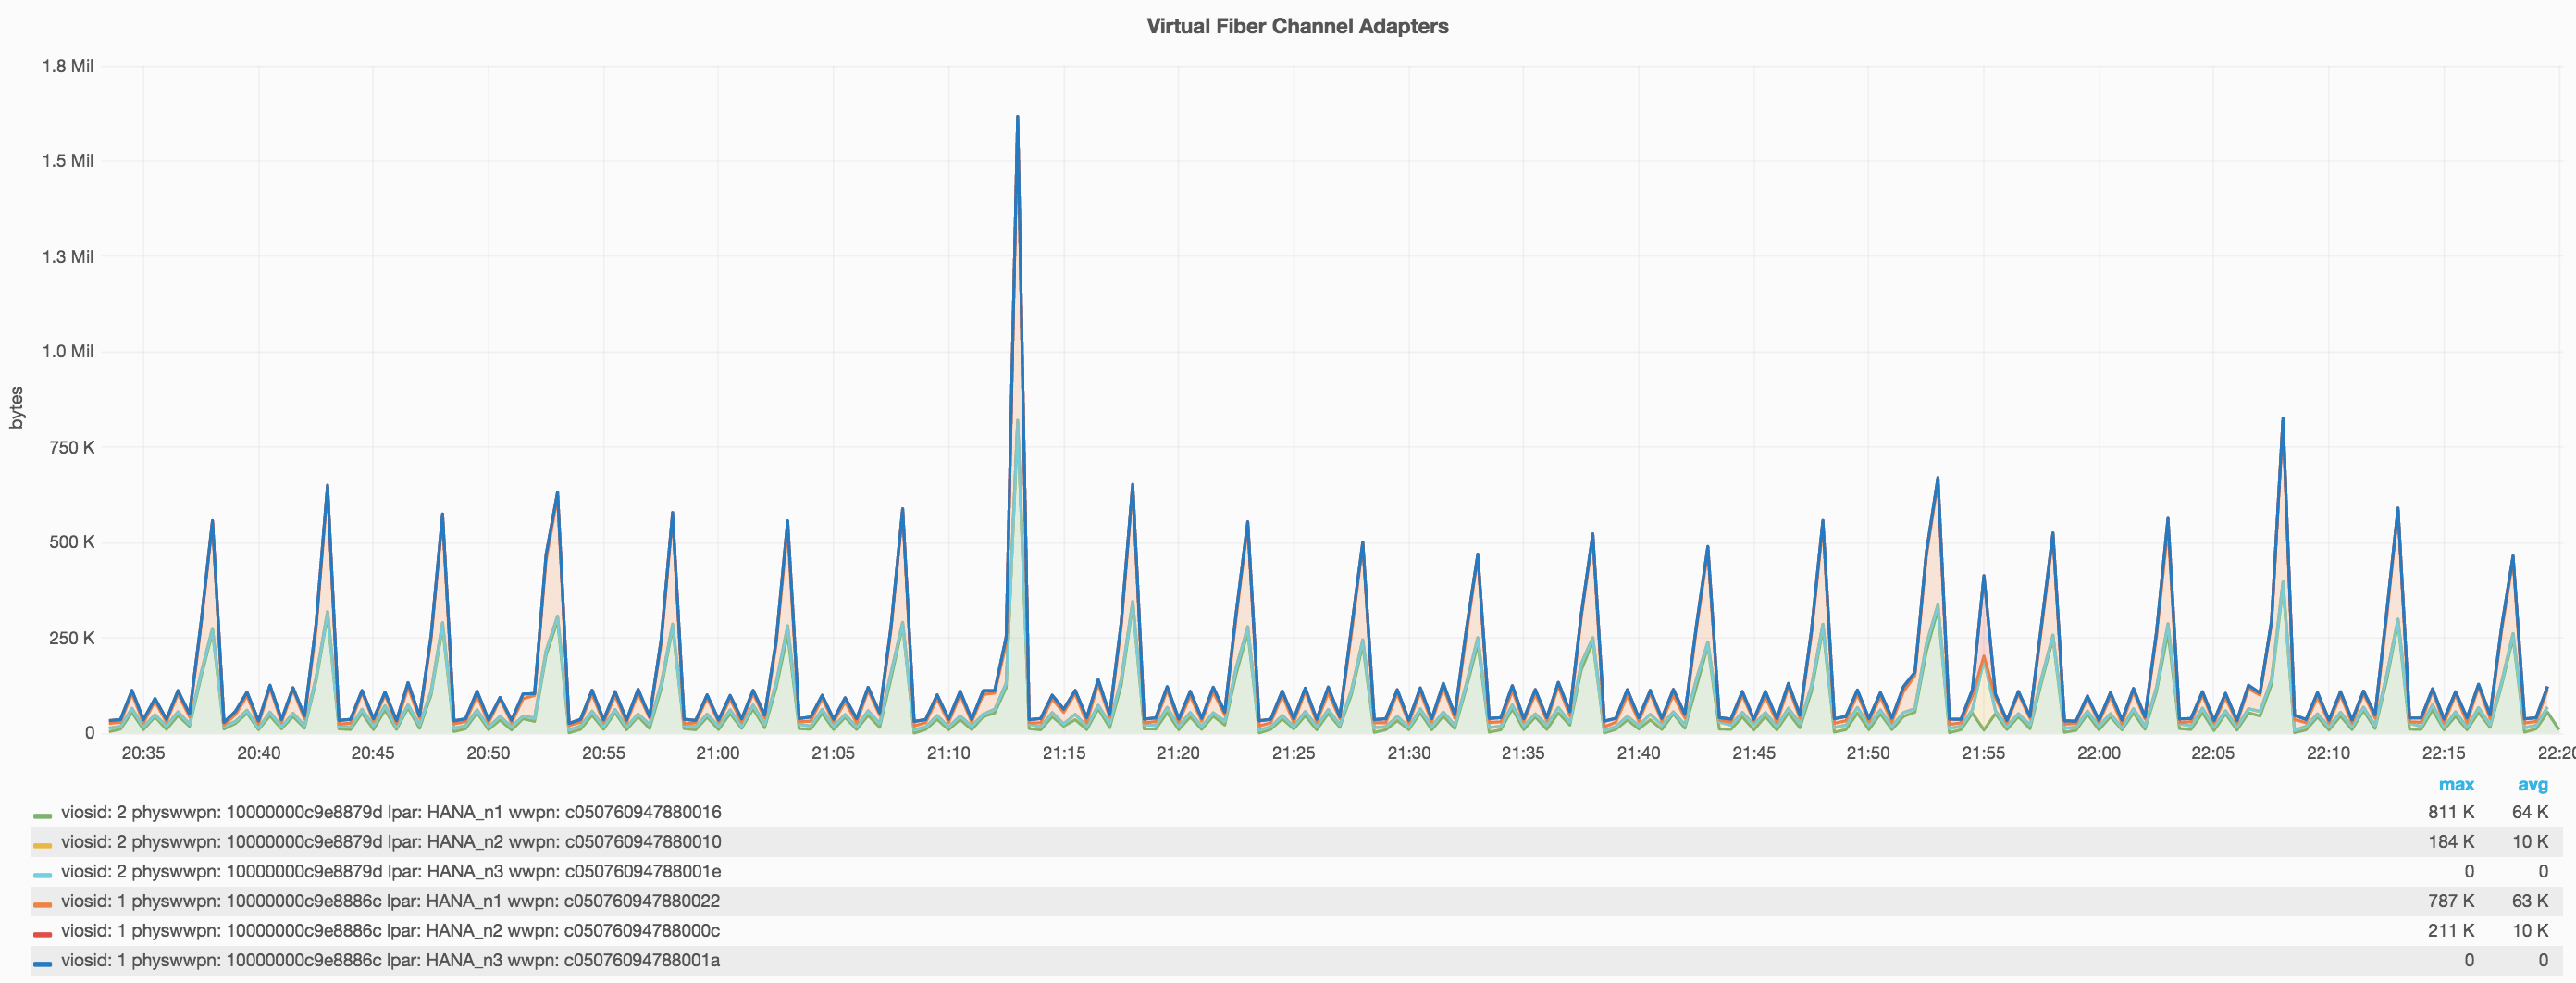
But you can also choose to display the vio server id and the physical wwpn for multiple partitions on the same chart:
System measurements
SystemProcessor
It’s almost the same than partition level but for the whole system:

SystemSharedProcessorPool
It’s also possible to see cpu usage at system level by shared processor pools.

SystemMemory
A memory allocation view at system level.

SystemFiberChannelAdapters
HMC doesn’t provides metrics for physical FC adapters at client partition level but does it for vios.

SystemGenericPhysicalAdapters
It’s the same for generic physical adapters.

SystemGenericVirtualAdapters
This measurement will give all vhost statistics.

SystemGenericAdapters
Here again, the name is not obvious but it’s where you will find all ethernet adapters physical and virtual.

SystemSharedAdapters
This view can be used to see the Shared Ethernet Adapters statistics.

SystemSharedStoragePool
The last but not the least :) HMC gives great metrics to see the Shared Storage Pool usage.

It’s also giving throughput metrics:

But an interesting thing given by using InfluxDB is we can display metrics from different systems belonging to the same Shared Storage Pool. So we can see in one chart the I/O activity of all vios belonging to the same Shared Storage Pool.

Tagging is living :)
Without tagging the measurements, charts would not so flexible. It’s what gave the powerful data analysis capabilities. On nmon files, tagging was pretty limited but PCM data comes with a lot of informations allowing a lot more tagging and making data analysis a lot stronger.
One of InfluxDB great advantage is his SQL-like query system. It allows to group measurements by tags and apply filters in a great way.
It’s better to show what are the available tags on a measurement:
SELECT * FROM PartitionVirtualEthernetAdapters LIMIT 1
name: PartitionVirtualEthernetAdapters
--------------------------------------
time			SEA	ViosID	VlanID	VswitchID	name		partition	system		value
1479669301000000000	ent4	1	1130	0	sentBytes	adxlpar2	p750B	39
So here we see we have this tags: SEA, ViosID, VlanID, VswitchID, name, partition, system and value.
It’s possible to see all values for a specific tag:
SHOW TAG VALUES FROM "PartitionVirtualEthernetAdapters" WITH KEY = "partition"
name: PartitionVirtualEthernetAdapters
--------------------------------------
key		value
partition	test_n1
partition	test_n2
partition	test_n3
And filter based on this value with a WHERE clause:
SELECT * FROM PartitionVirtualEthernetAdapters WHERE "partition" = 'test_n1' LIMIT 1
name: PartitionVirtualEthernetAdapters
--------------------------------------
time			SEA	ViosID	VlanID	VswitchID	name		partition	system		value
1479669301000000000	ent4	1	1130	0		ReceivedBytes	test_n1	testsys1	1502
GROUP BY is really powerful. It’s also possible to perform calculations on this metrics. Here I use the mean function:
SELECT MEAN(value) FROM PartitionVirtualEthernetAdapters  GROUP BY "VlanID"LIMIT 1
name: PartitionVirtualEthernetAdapters
tags: VlanID=1
time	mean
----	----
0	26.14571920001631

name: PartitionVirtualEthernetAdapters
tags: VlanID=10
time	mean
----	----
0	0

name: PartitionVirtualEthernetAdapters
tags: VlanID=1130
time	mean
----	----
0	754.0389195656023
It’s pretty nice to be able to query performance metrics like that but where it’s becoming really great is when you combine it with the query editor provided by Grafana.

It’s making complex queries fun. It will display for you all the available tags. You can easily build your chart without knowing InfluxDB SQL-Like syntax.
Templating
Grafana add another great feature by allowing templating.

It will create a variable with values generated from an InfluxDB query:
SHOW TAG VALUES FROM "SystemProcessor" WITH KEY = "system"
name: SystemProcessor
---------------------
key	value
system	POWER8-S824A
system	Server-9117-MMC-SN105C627
system	p750-SSIS
system	p750A
system	p750B
system	p755-HPC
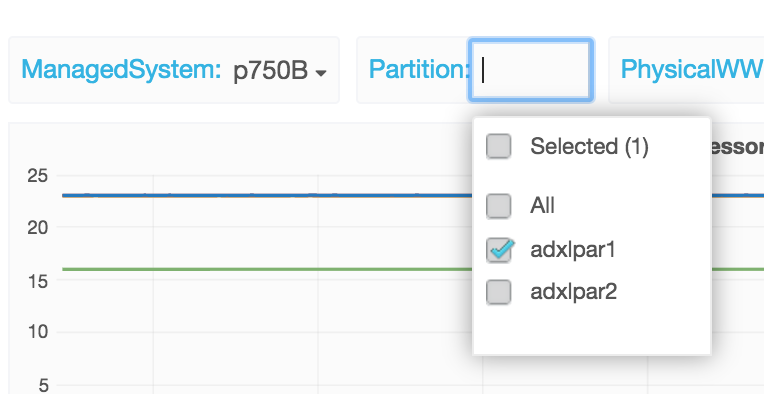
It’s also possible to have nested templating with query like that:
SHOW TAG VALUES FROM "PartitionProcessor" WITH KEY = "partition" where system =~ /$ManagedSystem/It’s really useful for HMC data. It allows to display only partitions belonging to a managed system:
wrapping up
HMC developers gave us a great way to measure system performance.
Their API is maybe a little bit complex ;) but it’s very powerful.
I had a lot of fun developing this feature and I hope you will find it useful. Feedbacks are welcome. :)