nmon2influxdb tagging partitions
I added a new functionality allowing to add custom tags on partitions imported from NMON or HMC. In this post, I will explain how to implement it and what you can do with it.
concept
When importing a NMON file or PCM data from a HMC, nmon2influxdb break the different performance metrics in measurements.
For example, a standard HMC import will create different measurements inside the InfluxDB database nmon2influxdbHMC. It’s possible to use the influx command provided with InfluxDB to run InfluxQL queries to see what measurements was created.
> use nmon2influxdbHMC
Using database nmon2influxdbHMC
> show measurements
name: measurements
name
----
PartitionMemory
PartitionProcessor
PartitionVSCSIAdapters
PartitionVirtualEthernetAdapters
PartitionVirtualFiberChannelAdapters
SystemFiberChannelAdapters
SystemGenericAdapters
SystemGenericPhysicalAdapters
SystemGenericVirtualAdapters
SystemMemory
SystemProcessor
SystemSharedAdapters
SystemSharedProcessorPool
SystemSharedStoragePool
SystemgenericPhysicalAdapters
You can find this measurements used in my sample Grafana dashboard available on my demo website: demo.nmon2influxdb.org.
Each measurement has tags associated to it. Like you can see in the measurement list above, we don’t have any notion of partition name or attribute in the measurement itself. It’s storing all values for all partitions and systems. To differentiate them tags are used. Influxql language allows to see what are the tag keys associated with a measurement.
> show tag keys from PartitionProcessor
name: PartitionProcessor
tagKey
------
name
partition
system
By design, nmon2influxdb will store in the name tag the different kind of attributes. It’s possible to see the values associated to this key with the show key values query:
> show tag values from "PartitionProcessor" with key = "name"
name: PartitionProcessor
key	value
---	-----
name	DonatedProcUnits
name	EntitledProcUnits
name	IdleProcUnits
name	MaxProcUnits
name	MaxVirtualProcessors
name	TimePerInstructionExecution
name	TimeSpentWaitingForDispatch
name	UtilizedCappedProcUnits
name	UtilizedProcUnits
name	UtilizedUncappedProcUnits
It’s also possible to see this tags by fetching one value from one measurement:
> select * from PartitionProcessor limit 1;
name: PartitionProcessor
time			name			partition		system	value
----			----			---------		------	-----
1481358609000000000	DonatedProcUnits	BCK DR #adxlpar2	p750A	0
Tags are great and allows to build very complex queries easily. They are also indexed so it’s making querying them pretty fast. But it’s using resources on the database, mainly memory. So it needs to be used with care to avoid a too high cardinality like described on InfluxDB web site(series cardinality). For example, it would be a very bad design to have thousand of unique values in the same tag.
Below is a query displaying the partition virtual ethernet adapters statistics. Tags are making it more easy to understand:
SELECT mean("value") FROM "PartitionVirtualEthernetAdapters" WHERE "partition" = 'WM-SLES1' AND "name" =~ /Bytes/ AND "name" =~ /PhysicalBytes/ AND "system" = 'POWER8-S824A' GROUP BY "name", "VlanID" fill(null)Obviously most people use Grafana query editor to make this kind of query:

tag design
In nmon2influxdb, I think tagging choices are mostly ok for HMC import but could be better for NMON files. The main issue for nmon files is the number of hdisk. When you have partitions with thousand different disks it’s making hard to have an optimized design. I am still thinking on how to improve it.
Grafana templating
variable
The best way to see how it’s working is to go on the demo website to see the hmc_partition dashboard.
This dashboard use only default tags but it show how Grafana templating can be used:
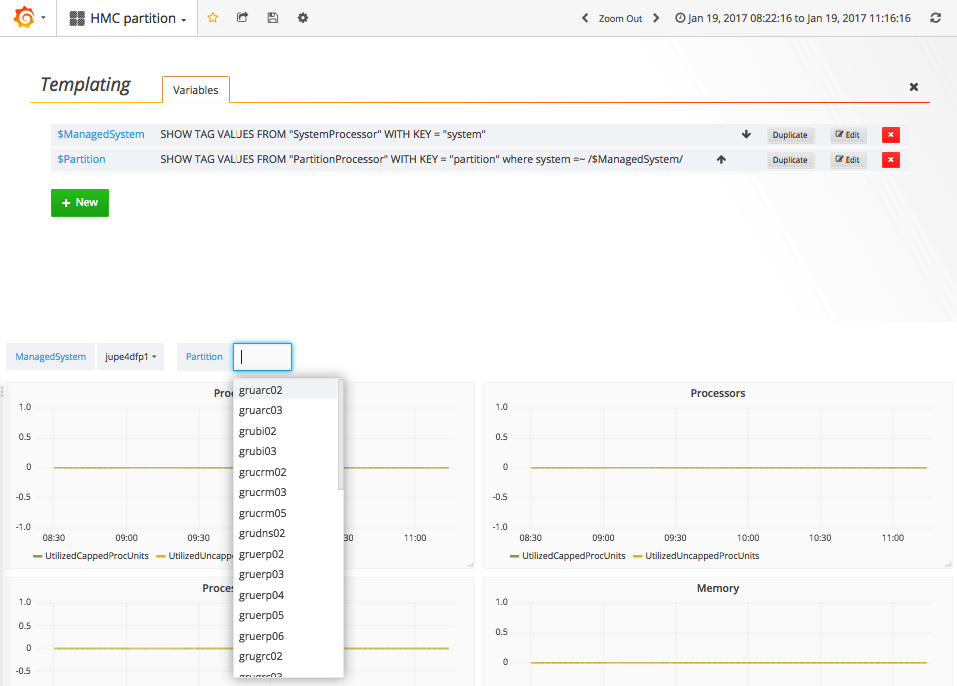
Below is an example where a variable is created to get a list of all the managed systems.
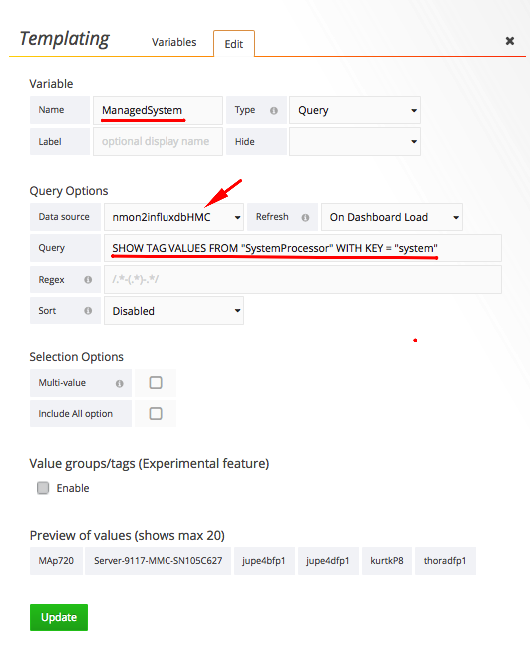
When creating a template variable, you can choose to perform your query against any data source defined in Grafana. It can be another InfluxDB database or any other kind of database supported by Grafana. For example, you could perform your query in the database storing your HMC data like here(nmon2influxdbHMC) or on the one storing the NMON files(nmon_reports by default). It means the query itself can be completely unrelated to the data you display in your dashboard. What is important is to have a result meaning something in your dashboard.
In this example, the query is:
SHOW TAG VALUES FROM "SystemProcessor" WITH KEY = "system"Something to note is Grafana doesn’t provide a query editor in the templating section. So to build your query it’s better to use the influx command and experiment by yourself.
You can also check the official documentation: InfluxQL query language
The variable itself can be used in any part of the query in each chart.
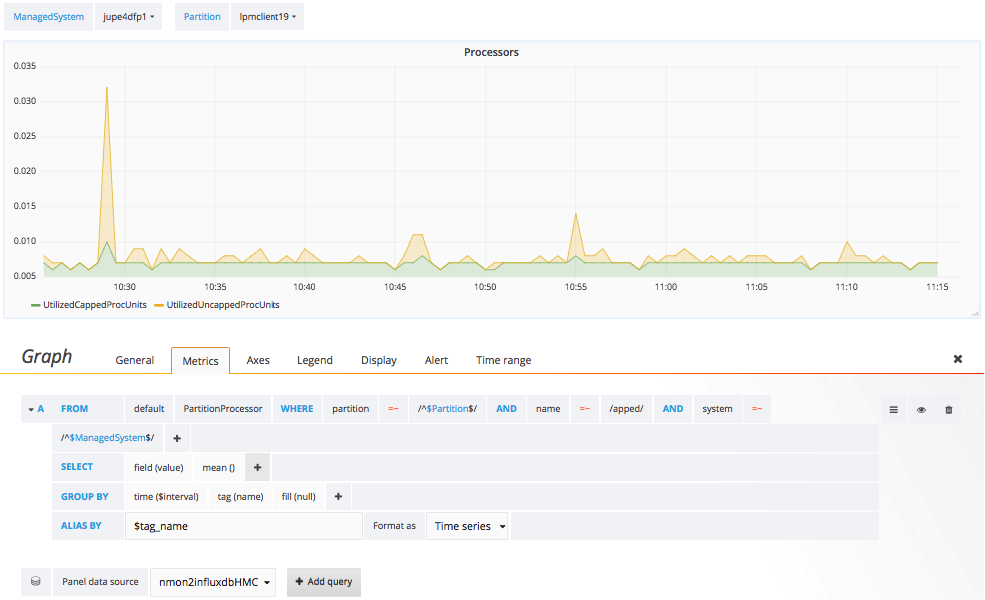
In this dashboard, the variable ManagedSystem is never used directly in chart. Only the Partition variable is used. ManagedSystem is used to build the nested variable.
nested variable
Grafana templating model allows nesting variables. So you can use the selection from a previous query inside another variable.
In the example above, the Partition variable is built with this query:
SHOW TAG VALUES FROM "PartitionProcessor" WITH KEY = "partition" where system =~ /$ManagedSystem/$ManagedSystem is automatically replaced by the current value of ManagedSystem.
Adding custom tags
Starting with version 2.1.0, I introduced the capability to add custom tags. It can be useful to group partitions, mark them as critical, specifying their datacenter or rack or any kind of informations not possible to get directly from the HMC or a NMON file.
All the custom tagging is done in the nmon2influxdb configuration file(by default ~/.nmon2influxdb.cfg). The documentation about it is available on the web site.
To explain it in details, I will start from this configuration:
[[input]]
  Measurement="PartitionProcessor"
  Name="partition"
  Match="lpm"
  [[input.tag]]
    Name="datacenter"
    Value="DC1"
To add a tag, you need to create a custom stanza named input.
Here we check if the tag named partition has a value matching the regular expression /lpm/.
If yes, we will add the custom tag named datacenter with value DC1.
It’s possible to add multiple tags for the same match and/or to have different input sections for different systems:
[[input]]
  Measurement="PartitionProcessor"
  Name="partition"
  Match="lpm"
  [[input.tag]]
    Name="datacenter"
    Value="DC1"
  [[input.tag]]
    Name="group"
    Value="LPM"
[[input]]
  Measurement="PartitionProcessor"
  Name="partition"
  Match="gru"
  [[input.tag]]
    Name="datacenter"
    Value="DC1"
  [[input.tag]]
    Name="group"
    Value="GRU"
best practices
It’s better to not add tags to every measurements. It would increase the load on the InfluxDB database without having benefits. It’s recommended to add custom tags on PartitionProcessor when it’s a HMC import and on CPU_ALL when it’s a NMON import. The reason is this measurements will always be present in the data collection. So you will be able to use them in templating in all cases.
Examples
The first example is named hmc tagged partition.
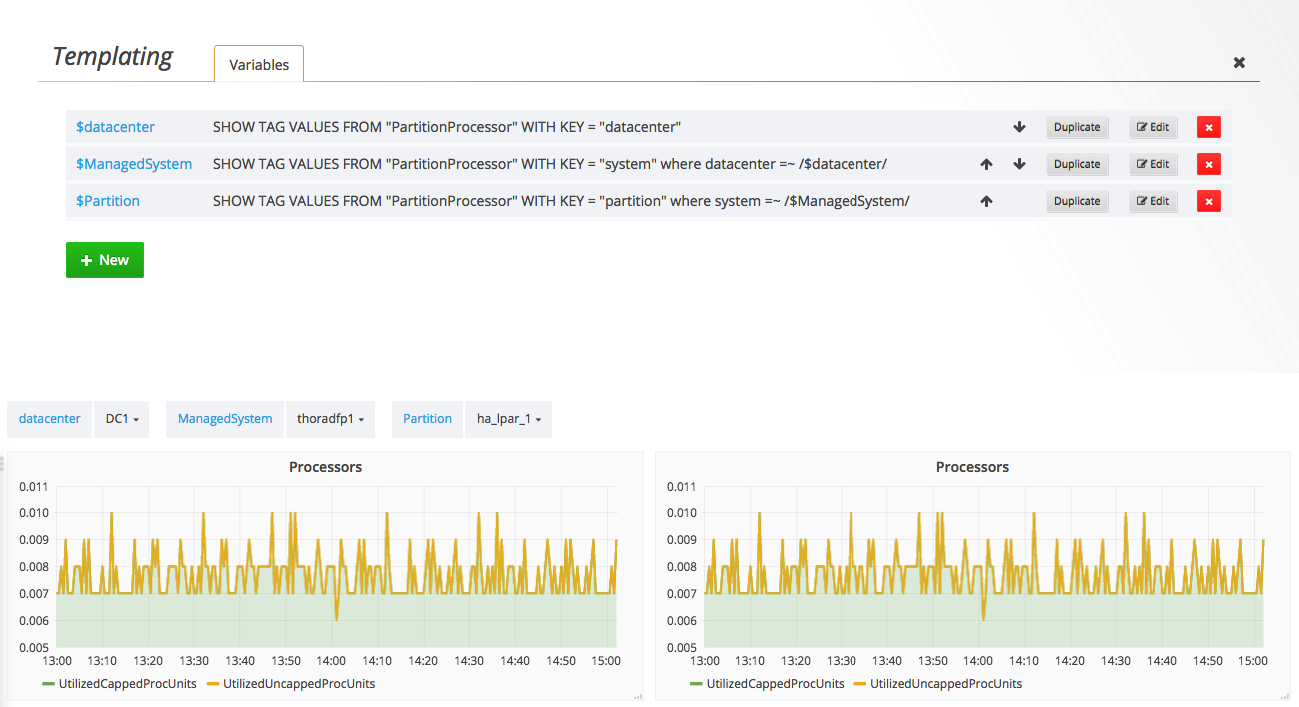
It’s almost the same than the previous example but queries are different. In the hmc partition, we had two queries:
SHOW TAG VALUES FROM "SystemProcessor" WITH KEY = "system"
SHOW TAG VALUES FROM "PartitionProcessor" WITH KEY = "partition" where system =~ /$ManagedSystem/
Here we have three queries:
SHOW TAG VALUES FROM "PartitionProcessor" WITH KEY = "datacenter"
SHOW TAG VALUES FROM "PartitionProcessor" WITH KEY = "system" where datacenter =~ /$datacenter/
SHOW TAG VALUES FROM "PartitionProcessor" WITH KEY = "partition" where system =~ /$ManagedSystem/
So we use the datacenter variable to limit the list of managed systems. It’s almost the same. But we are not using SystemProcessor measurement anymore because custom tags was not added on it but only on PartitionProcessor.
Another interesting use case is when you want to group partitions by purpose. So I made another example using a custom tag to group partitions: hmc grouped partitions.
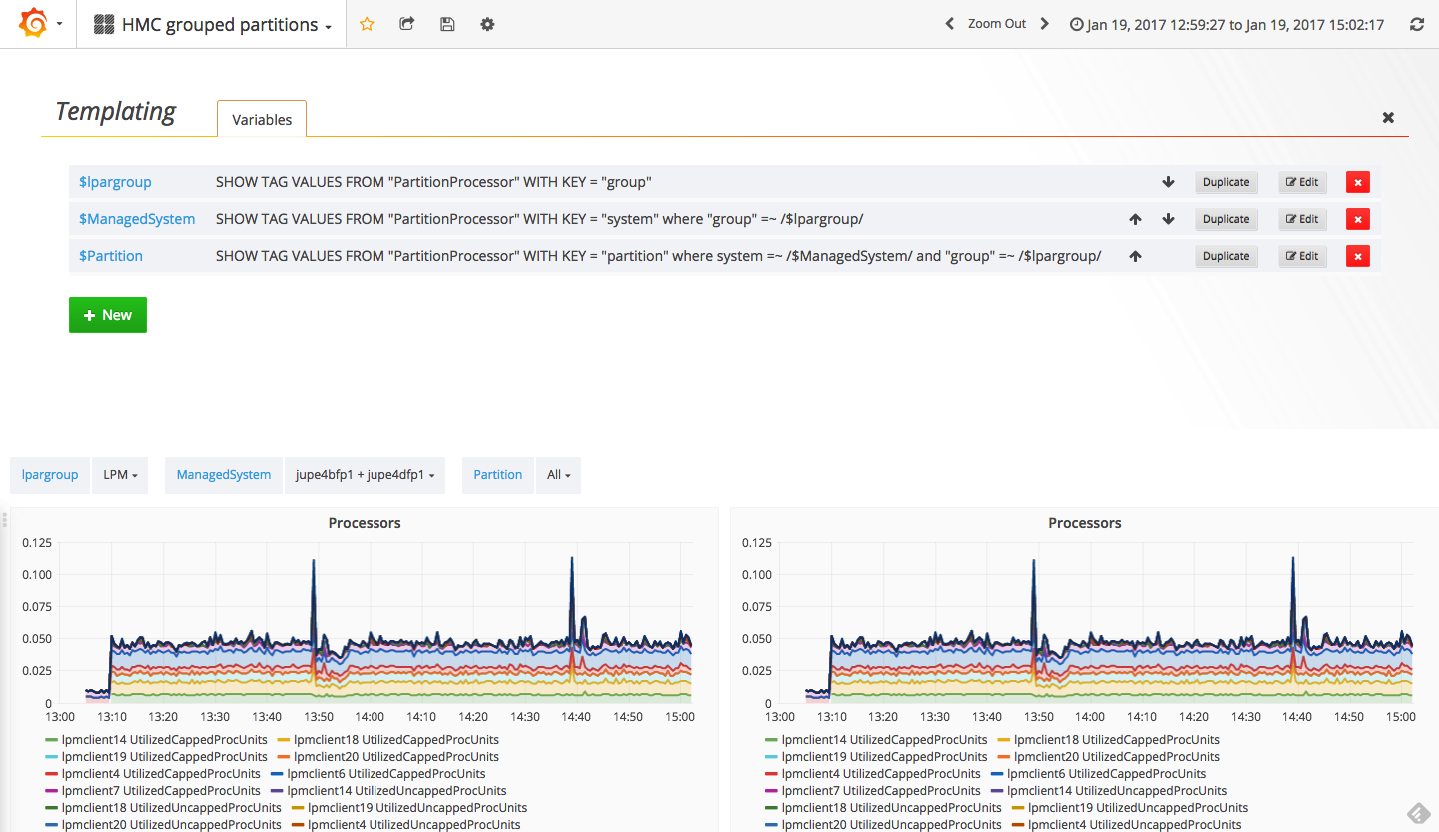
The last query is using multiple conditions:
SHOW TAG VALUES FROM "PartitionProcessor" WITH KEY = "partition" where system =~ /$ManagedSystem/ and "group" =~ /$lpargroup/Using the partition variable allows to display multiple partitions in the same chart:
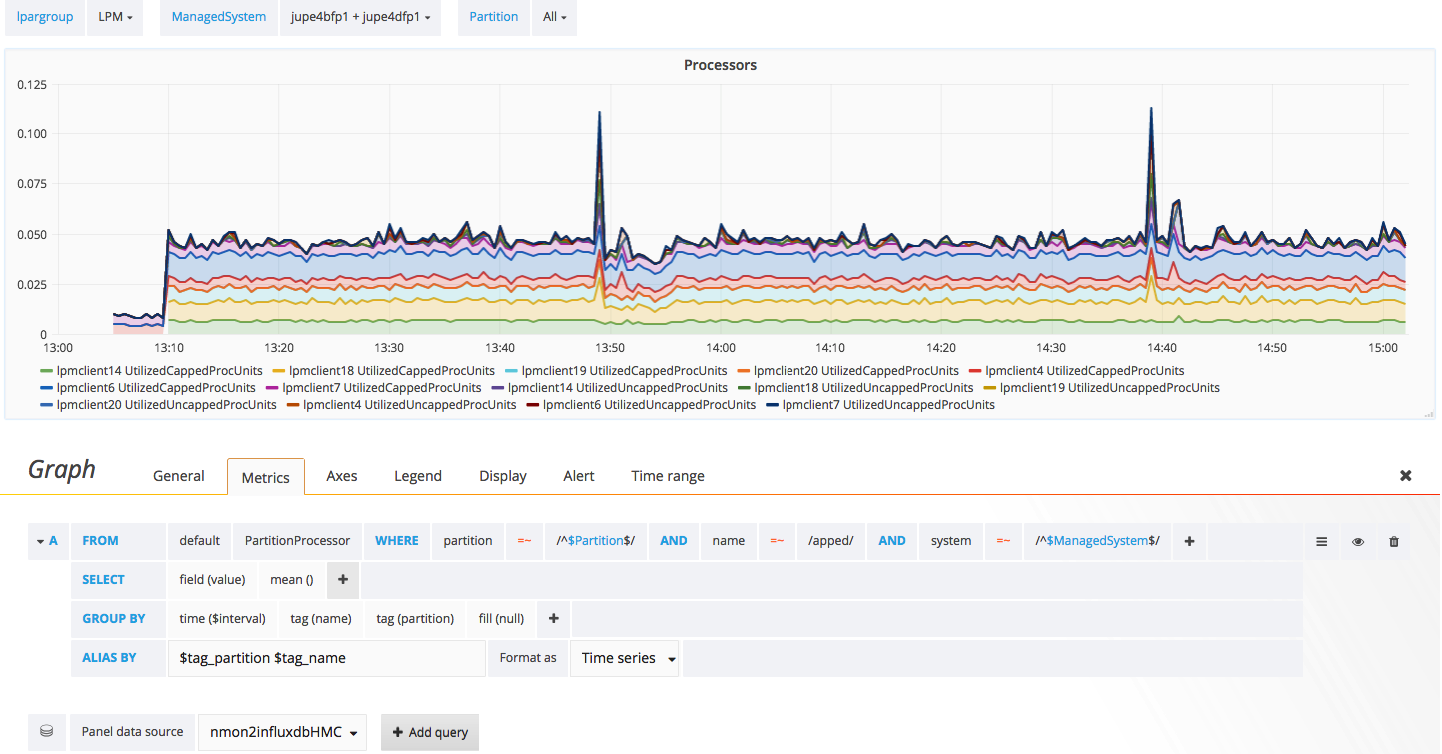
The critical part here is to add a “group by” partitions in the query, so the chart will display any number of partitions. The alias $tag_partition will also display the partition name in the legend.
The end
Grafana templating capabilities are really great. It allows to setup very complex dashboards easily. InfluxDB + Grafana allows me to analyze performances in a lot of different ways. I hope you will like it too. :)